10 Countries Where Renewables Replaced the Most Fossil Power
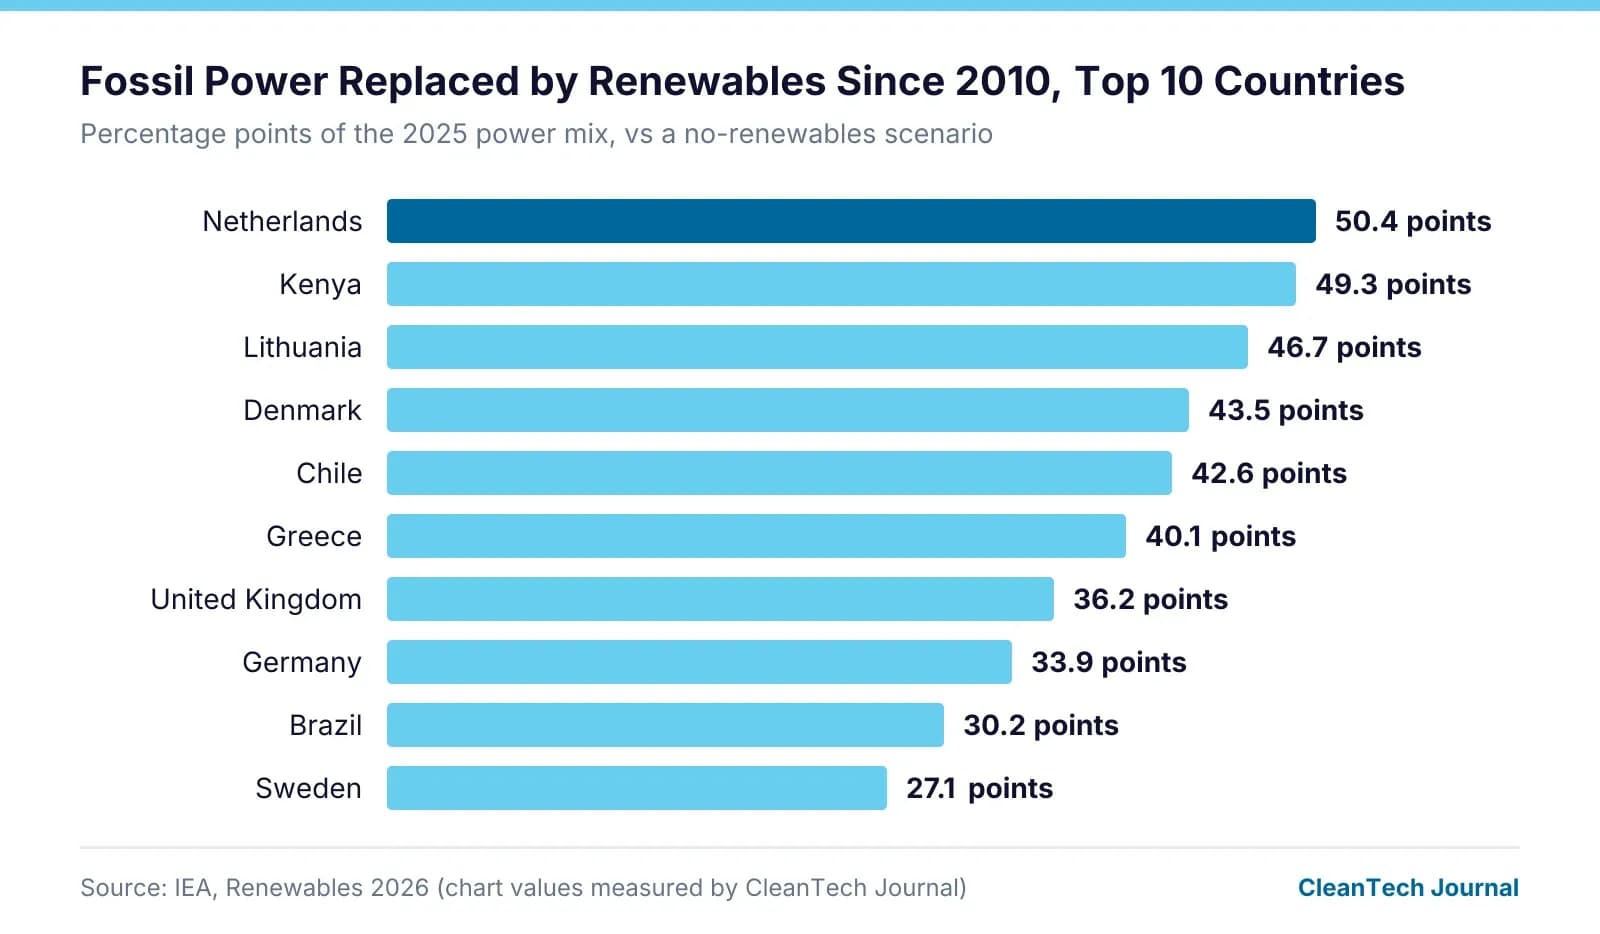
See the 10 countries where renewables replaced the most fossil power since 2010. The Netherlands leads, at 50.4 percentage points of its power mix.

Suraj Kadam
Published •26 min read
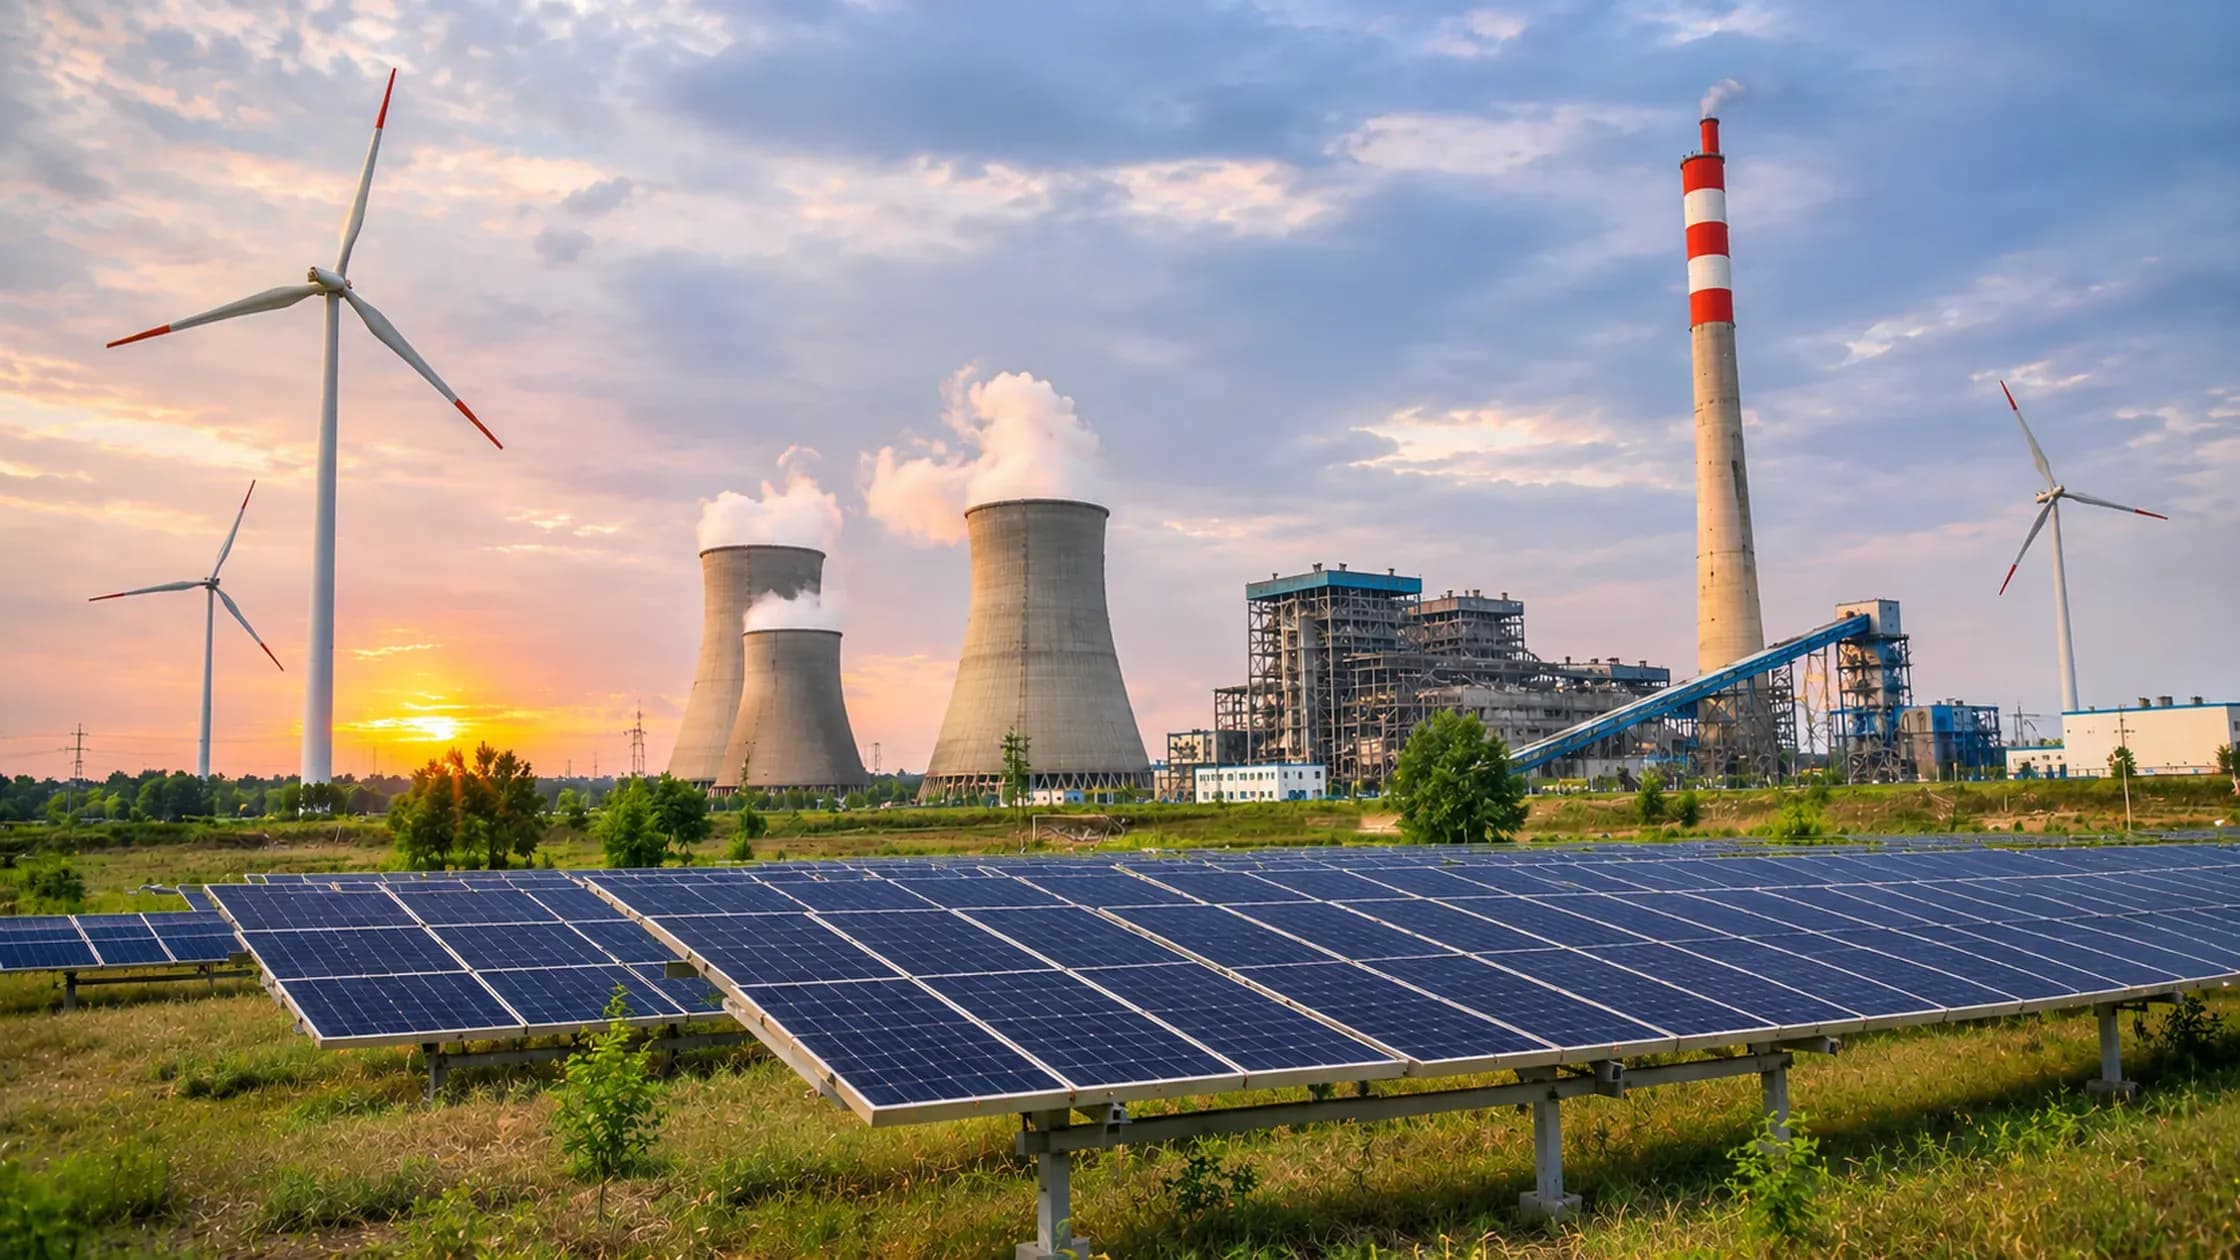
These are the 10 countries where renewables replaced the most fossil power, based on a scenario in the International Energy Agency's Renewables 2026 report. The scenario removes all renewable capacity built after 2010 and fills the gap with coal and gas plants. The ranking measures how many percentage points of each country's 2025 power mix those renewables replaced.
The Netherlands leads at 50.4 percentage points, driven by solar and wind, followed by Kenya, where geothermal power sits at the heart of the grid. Wind lifts Lithuania and Denmark into third and fourth place, and seven of the 10 countries are in Europe.
Countries Ranked by Fossil Power Replaced by Renewables
Rank | Country | Fossil share of power replaced by renewables (percentage points) |
|---|---|---|
1 | Netherlands | 50.4 |
2 | Kenya | 49.3 |
3 | Lithuania | 46.7 |
4 | Denmark | 43.5 |
5 | Chile | 42.6 |
6 | Greece | 40.1 |
7 | United Kingdom | 36.2 |
8 | Germany | 33.9 |
9 | Brazil | 30.2 |
10 | Sweden | 27.1 |
How We Ranked These 10 Countries
- Ranked by: the percentage points of each country's 2025 electricity generation that renewables built since 2010 replaced, compared with a scenario with no new renewable capacity after 2010. This is the only measure used for the order.
- Scenario: in this modelled case, coal and gas plants supply the electricity that renewables built since 2010 actually produced. Other sources, such as nuclear, stay unchanged.
- Data source: IEA, Renewables 2026: Analysis and forecasts to 2031, chapter 5 (energy security), retrieved 2026-11-11.
- Included: the 27 countries shown in the source chart.
- Excluded: countries the chart does not cover, such as the United States, Australia and Mexico.
- Ties: none in this list. Spain is 11th, at 27.0 points.
- Figures: the source chart has no printed values, so CleanTech Journal measured each bar from the chart data in the report and rounded it to one decimal place. Comparisons between entries are our own calculation from these figures.
1. Netherlands
Renewables built since 2010 replaced 50.4 percentage points of the Netherlands' fossil power. Fossil fuels produced around 45% of its electricity in 2025, against about 96% in the no-renewables scenario.
The change comes mainly from solar panels and wind turbines. Statistics Netherlands figures for 2025 show renewables produced 49% of a record 132 billion kWh. Solar alone supplied 25.5 billion kWh, onshore wind 16.4 billion kWh and offshore wind 15.6 billion kWh.
The country also exported a record 30 billion kWh in 2025. Its offshore wind roadmap aims for 21 GW of capacity in the North Sea by the end of 2032.
2. Kenya
Renewables built since 2010 replaced 49.3 percentage points of Kenya's fossil power. It is the only African country in the list.
Kenya's power system is built around geothermal energy from the Rift Valley, alongside hydropower, wind and a growing amount of solar. The national energy regulator, EPRA, reported that renewables made up 80.17% of the electricity mix in its latest review.
The same review counts 940 MW of geothermal capacity, all of East Africa's geothermal power, out of 3,192 MW installed in Kenya. Unlike wind and solar, geothermal plants can run around the clock.
3. Lithuania
Renewables built since 2010 replaced 46.7 percentage points of Lithuania's fossil power. Fossil fuels produced around 15% of its electricity in 2025, against about 62% in the no-renewables scenario.
Wind is the main reason. Grid operator Litgrid reports that wind met 33% of national consumption in 2025, second in Europe, and solar met 14%.
Wind capacity grew by 0.8 GW in a year to 2.5 GW, while solar grew by 1 GW to 3 GW. The national energy strategy aims to connect about 10 GW of renewables by 2030, enough to cover all of the country's electricity needs.
4. Denmark
Renewables built since 2010 replaced 43.5 percentage points of Denmark's fossil power. Fossil fuels produced only around 5% of its electricity in 2025, against about 48% in the no-renewables scenario.
Wind power drives this result. WindEurope's 2025 statistics show wind met 50% of Denmark's electricity demand, the highest share of any country in Europe.
Denmark combines onshore turbines with large offshore wind farms in the North Sea and the Baltic Sea. Solar power has also grown in recent years.
5. Chile
Renewables built since 2010 replaced 42.6 percentage points of Chile's fossil power, the highest in the Americas in this list. Fossil fuels produced around 31% of its electricity in 2025, against about 74% in the no-renewables scenario.
Solar farms in the Atacama Desert, one of the sunniest places on Earth, are the main driver, along with wind. Climate Action Tracker reports that renewables rose to about 70% of Chile's electricity in 2024, from 46% in 2019. Solar alone supplied 22%.
Chile has also been closing coal plants, with 11 retired as of July 2025. Its official target is to phase out coal power by 2040.
6. Greece
Renewables built since 2010 replaced 40.1 percentage points of Greece's fossil power. Fossil fuels produced around 44% of its electricity in 2025, against about 84% in the no-renewables scenario.
Data reported by Balkan Green Energy News show renewables produced a record 46.7% of Greek power in 2025. Lignite, once the backbone of the system, fell to a historic low of 4.8%.
Solar and wind are the main renewable sources. Greece also became a larger exporter, with net exports of over 3 TWh in 2025, about ten times the previous year.
7. United Kingdom
Renewables built since 2010 replaced 36.2 percentage points of the United Kingdom's fossil power. Fossil fuels produced around 32% of its electricity in 2025, against about 68% in the no-renewables scenario.
Government figures summarised by Osborne Clarke show renewables produced 52.1% of UK electricity in 2025. Wind was the largest clean source, at 29.5% of generation.
The UK's last coal power station, Ratcliffe-on-Soar, closed in September 2024. As a result, no electricity was generated from coal in 2025.
8. Germany
Renewables built since 2010 replaced 33.9 percentage points of Germany's fossil power. Fossil fuels produced around 40% of its electricity in 2025, against about 74% in the no-renewables scenario.
In 2025, wind and solar produced more electricity than fossil fuels in Germany for the first time. Carbon Brief's analysis puts wind and solar at 225 TWh, or 44% of generation, against 217 TWh, or 43%, from fossil fuels.
Germany aims for renewables to cover 80% of its electricity consumption by 2030. Coal generation has been falling, and the official deadline to end coal power is 2038.
9. Brazil
Renewables built since 2010 replaced 30.2 percentage points of Brazil's fossil power. Fossil fuels produced around 10% of its electricity in 2025, against about 40% in the no-renewables scenario.
Brazil already had a mostly hydro-based power system before 2010, so the change comes mainly from new wind and solar. Ember's Brazil data show wind and solar produced 27% of the country's electricity in 2025.
Hydropower remains the largest source, at 52%. In total, clean sources produced 89% of Brazil's electricity in 2025.
10. Sweden
Renewables built since 2010 replaced 27.1 percentage points of Sweden's fossil power, just 0.1 points more than in 11th-placed Spain. Its fossil share is close to zero, against about 27% in the no-renewables scenario.
Wind power has grown into a major source. Statistics Sweden data for January to October 2025 show wind produced 31.2 TWh, or 23% of domestic generation.
Hydropower, at 40%, and nuclear, at 27%, made up most of the rest. Sweden was also a large net exporter, selling 27 TWh more electricity abroad than it bought over the same period.
Wind, Solar and Coal Exits Drive the Ranking
Most of the countries at the top replaced fossil power mainly with wind and solar. Denmark and Lithuania rely mostly on wind, while the Netherlands, Greece and Chile have added large amounts of solar alongside wind.
Coal closures sit behind several entries. The United Kingdom generated no coal power in 2025, Greek lignite fell to under 5% of supply, and Chile has retired 11 coal plants.
The emerging economies on the list followed different paths. Kenya built its system around geothermal power, while Brazil added wind and solar to an already hydro-heavy grid.
SOURCES
- IEA, Renewables 2026: Analysis and forecasts to 2031
- Statistics Netherlands: Production and export of electricity at record levels
- RVO: New planning for offshore wind energy
- Litgrid: Lithuania ranks second in Europe for wind share of consumption
- WindEurope: Wind energy in Europe, 2025 statistics
- Carbon Brief: Wind and solar overtake fossil fuels in Germany
- Ember: Brazil
Written by
Suraj Kadam
Suraj Kadam is a journalist and Chief Editor of CleanTech Journal, a knowledge and media platform covering clean technology, solar energy, and renewable energy. He reports on emerging technologies, industry developments, policy trends, and innovations shaping the global clean energy transition. Through his editorial work, Suraj aims to make complex clean technology topics accessible to industry professionals, researchers, policymakers, and readers interested in sustainable energy. His work focuses on delivering insightful, informative, and engaging coverage of the evolving renewable energy landscape.