How Much Do Home Solar Panels Cost in the US? 10 Key Figures
How much home solar panels cost in the US in 2026: median price USD 3.60 per watt, about USD 27,700 for a typical system, and no federal tax credit.

Suraj Kadam
Published •57 min read
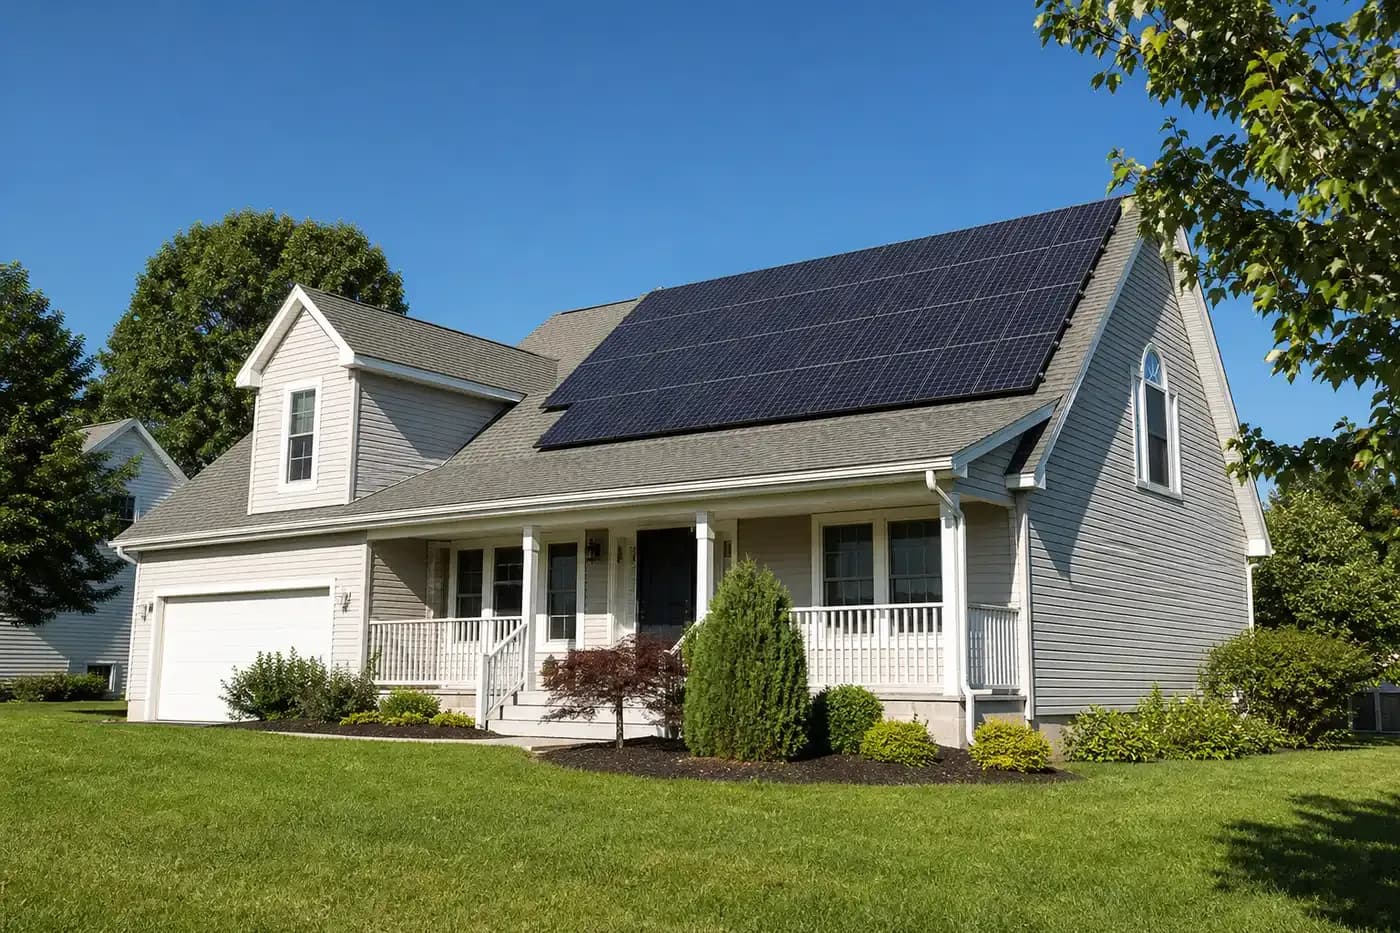
About 450,000 American homes installed rooftop solar in 2025, bringing the total to roughly 5.3 million, according to Lawrence Berkeley National Laboratory's Distributed Solar and Storage Data: 2026 Update. Prices kept falling, but buyers in 2026 face a new reality: the federal solar tax credit for homeowners is gone.
CleanTech Journal has gathered the 10 key figures that decide how much home solar panels cost in the US, using independent installed-price data from Berkeley Lab, tax rules from the IRS and electricity prices from the U.S. Energy Information Administration (EIA). Unlike quotes from a single marketplace, Berkeley Lab's figures cover most of the US rooftop solar market. All prices are before incentives unless stated otherwise.
Home Solar Costs at a Glance
Figure | Value |
|---|---|
Median installed price (2025) | USD 3.60 per watt |
Median system size | 7.7 kW |
Typical cost of a median system | About USD 27,700 |
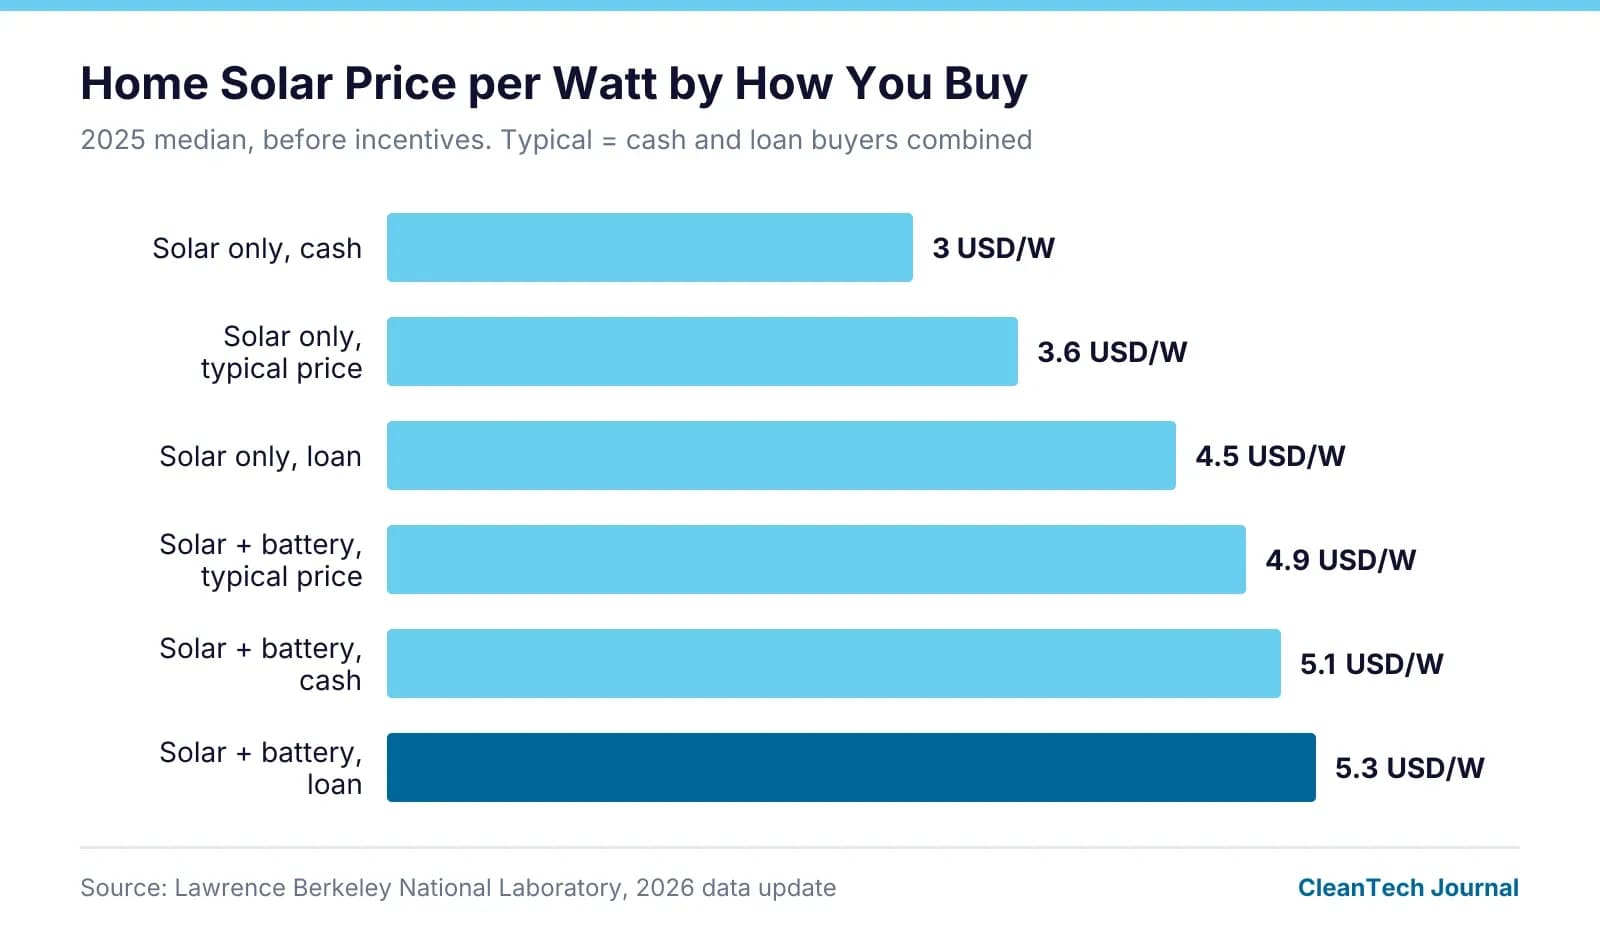
Price with cash purchase | USD 3.00 per watt |
Price with a loan | USD 4.50 per watt |
Price with battery storage | USD 4.90 per watt |
Homes adding a battery | 37% |
Federal tax credit for homeowners installing in 2026 | None |
Average residential electricity price (2025) | 17.24 cents per kWh |
1. The Median Price per Watt Keeps Falling
Solar is priced per watt of panel capacity, which makes systems of different sizes easy to compare. The median installed price of a homeowner-owned rooftop system was USD 3.60 per watt in 2025, according to Berkeley Lab.
That was down from USD 4.10 per watt in 2024, a drop of about 12% in a single year after adjusting for inflation. The price covers panels, inverters, racking, wiring, labor, permits and the installer's overheads and profit.
2. Typical Systems Are Getting Bigger
The median home solar system installed in 2025 was 7.7 kilowatts (kW), up from about 7.2 kW a year earlier. Most systems fell between 5 kW and 12 kW.
Systems keep getting bigger because panels are more efficient and many homes now add heat pumps, electric cars and batteries. Both average system size and panel efficiency have risen by about 50% since 2010.
3. What a Typical System Costs
At the median price of USD 3.60 per watt, a 7.7 kW system costs about USD 27,700 before any incentives. Because Berkeley Lab found no clear volume discount for larger home systems in 2025, cost rises roughly in line with size.
System size | Estimated cost at median price (USD 3.60/W) | Paying cash (USD 3.00/W) | With a battery (USD 4.90/W) |
|---|---|---|---|
4 kW | USD 14,400 | USD 12,000 | USD 19,600 |
6 kW | USD 21,600 | USD 18,000 | USD 29,400 |
8 kW | USD 28,800 | USD 24,000 | USD 39,200 |
10 kW | USD 36,000 | USD 30,000 | USD 49,000 |
12 kW | USD 43,200 | USD 36,000 | USD 58,800 |
15 kW | USD 54,000 | USD 45,000 | USD 73,500 |
These estimates are CleanTech Journal calculations based on Berkeley Lab's national median prices. Your actual quote depends on your roof, your location and the installer you choose.
4. Paying Cash Is Much Cheaper Than a Loan
How you pay changes the price a lot. In 2025, the median price was USD 3.00 per watt for cash purchases but USD 4.50 per watt for loan-financed systems, according to Berkeley Lab.
For a 7.7 kW system, that is about USD 23,100 in cash against roughly USD 34,650 with a loan. Berkeley Lab notes that part of the gap comes from loan origination fees that are built into the system price, so a "zero-down" loan can cost far more than it first appears.
5. Your Installer Matters as Much as Your Hardware
Prices vary widely between companies. Among the 100 largest residential installers, median prices in 2025 ranged from USD 2.40 to USD 6.30 per watt.
About 60% of these installers had median prices below USD 4 per watt, and almost a quarter were below USD 3 per watt. For a 7.7 kW system, the gap between the cheapest and most expensive installers is more than USD 30,000, which is why comparing several quotes pays off.
6. Adding a Battery Raises the Price
More than a third of new home solar systems, 37%, came with a battery in 2025, up from 25% in 2024. The median battery size was 13.5 kilowatt-hours (kWh).
Solar-plus-storage systems had a median price of USD 4.90 per watt, against USD 3.60 for solar alone. On a 7.7 kW system, that difference adds roughly USD 10,000, and for cash buyers the gap was wider, at USD 2.10 per watt.
7. Most of the Cost Is Not the Panels
The solar panels themselves are now a small part of the bill. Soft costs and other balance-of-system costs, such as labor, permitting, sales, wiring and installer profit, make up about 80% of the median installed price, according to Berkeley Lab.
This means further savings will come mostly from cheaper installation, permitting and sales, not cheaper hardware. Permitting alone can take time: the slowest fifth of residential solar permits took 25 days or more to be issued in 2025.
8. Prices Have Fallen Sharply Over Two Decades
Home solar has become far more affordable over time. Installed prices have dropped by USD 9 to USD 11 per watt over the past two decades, a decline of roughly 70% to 80% after inflation.
Since 2014, the decline has been slower, averaging USD 0.10 to USD 0.20 per watt each year. The drop of about USD 0.50 per watt between 2024 and 2025 was unusually large by recent standards.
9. The Federal Tax Credit Has Ended for Homeowners
Until 2025, homeowners could claim the Residential Clean Energy Credit, which covered 30% of the cost of a solar system. Under the One Big Beautiful Bill Act, the IRS confirms the credit is not allowed for any expenditures made after December 31, 2025.
The IRS treats an expenditure as made when the installation is completed, not when it is paid for. A system finished in 2026 therefore does not qualify, which adds about USD 8,300 to the net cost of a typical 7.7 kW system compared with a year earlier.
Leased systems and power purchase agreements work differently, because the solar company owns the panels and claims a separate business tax credit. Under the same law, that credit is also being phased out for solar projects that start construction after July 4, 2026, so ask any leasing company how it affects your rate.
10. Rising Power Prices Make Solar More Valuable
The savings from solar depend on how much you pay for grid electricity. The average US residential electricity price was 17.24 cents per kWh in 2025, according to the EIA's Short-Term Energy Outlook.
The EIA expects it to rise to 18.17 cents in 2026 and 18.68 cents in 2027, about 8% higher than in 2025. Every increase in power prices shortens the time it takes for a solar system to pay for itself.
How Much Solar You Need to Cover Your Electricity Use
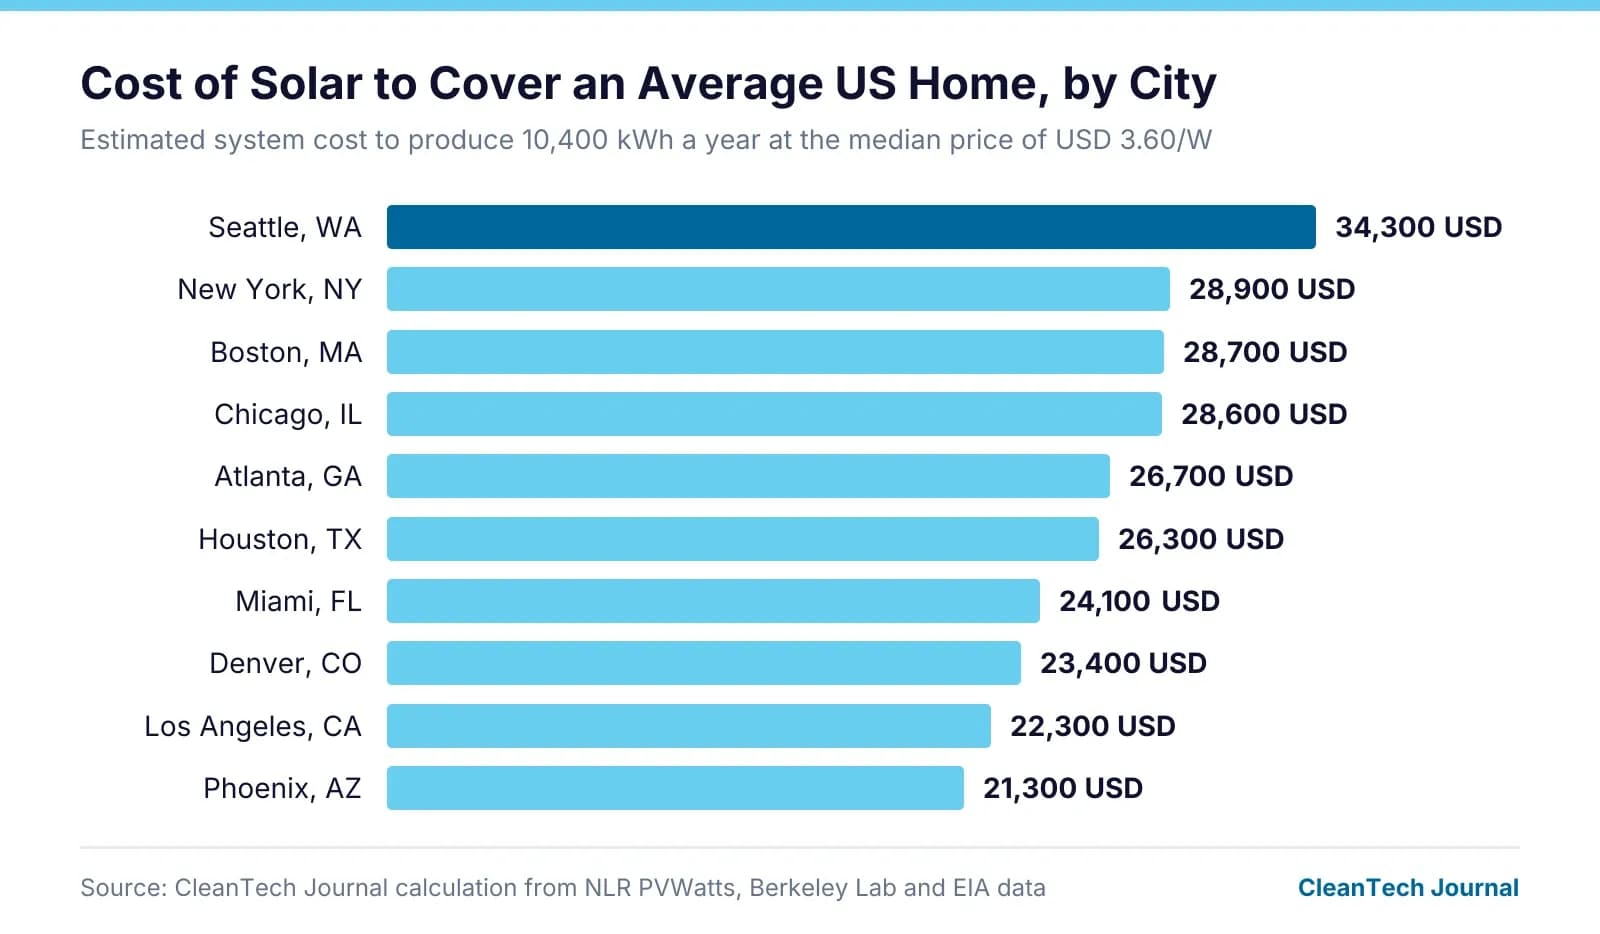
The average US home used about 865 kWh of electricity a month in 2024, or roughly 10,400 kWh a year, according to the EIA. How large a system you need to produce that much depends on how sunny your area is.
Using the PVWatts calculator from the National Laboratory of the Rockies, formerly the National Renewable Energy Laboratory, a 1 kW rooftop system produces about 1,755 kWh a year in Phoenix but only about 1,088 kWh in Seattle. That means the same home needs a much bigger, and more expensive, system in cloudier cities.
City | Yearly output per 1 kW of panels | System size to cover 10,400 kWh a year | Estimated cost at median price (USD 3.60/W) | Paying cash (USD 3.00/W) |
|---|---|---|---|---|
Phoenix, AZ | 1,755 kWh | 5.9 kW | USD 21,300 | USD 17,700 |
Los Angeles, CA | 1,677 kWh | 6.2 kW | USD 22,300 | USD 18,600 |
Denver, CO | 1,595 kWh | 6.5 kW | USD 23,400 | USD 19,500 |
Miami, FL | 1,552 kWh | 6.7 kW | USD 24,100 | USD 20,100 |
Houston, TX | 1,421 kWh | 7.3 kW | USD 26,300 | USD 21,900 |
Atlanta, GA | 1,402 kWh | 7.4 kW | USD 26,700 | USD 22,200 |
Chicago, IL | 1,308 kWh | 7.9 kW | USD 28,600 | USD 23,800 |
Boston, MA | 1,302 kWh | 8.0 kW | USD 28,700 | USD 23,900 |
New York, NY | 1,291 kWh | 8.0 kW | USD 28,900 | USD 24,100 |
Seattle, WA | 1,088 kWh | 9.5 kW | USD 34,300 | USD 28,600 |
If your home uses more or less than average, the table below shows the system size and cost needed in a sunny city (Phoenix), a mid-range city (Atlanta) and a cloudy city (Seattle).
Yearly electricity use | System size (Phoenix / Atlanta / Seattle) | Estimated cost at median price (Phoenix / Atlanta / Seattle) |
|---|---|---|
6,000 kWh | 3.4 / 4.3 / 5.5 kW | USD 12,300 / USD 15,400 / USD 19,900 |
10,400 kWh | 5.9 / 7.4 / 9.5 kW | USD 21,300 / USD 26,700 / USD 34,300 |
12,000 kWh | 6.8 / 8.6 / 11.0 kW | USD 24,600 / USD 30,800 / USD 39,700 |
15,000 kWh | 8.5 / 10.7 / 13.8 kW | USD 30,800 / USD 38,500 / USD 49,600 |
These are CleanTech Journal calculations. Output figures come from PVWatts version 8 for a south-facing, fixed rooftop system with a 20-degree tilt and the calculator's standard 14% system losses. Costs use Berkeley Lab's national median prices, so local quotes, roof direction and shading will change the result. You can find your monthly use on your electricity bill.
Where You Live Changes the Savings
The same solar panels are worth far more in some states than others, because each kWh they produce replaces electricity at local prices. Every 1,000 kWh a system produces is worth about USD 402 in Hawaii, but only about USD 119 in North Dakota, based on EIA residential prices for November 2025.
State | Residential electricity price (cents per kWh) | Value of 1,000 kWh of solar power |
|---|---|---|
Hawaii | 40.20 | USD 402 |
California | 31.91 | USD 319 |
Massachusetts | 31.22 | USD 312 |
Rhode Island | 30.82 | USD 308 |
Maine | 27.85 | USD 278 |
Montana | 12.82 | USD 128 |
Louisiana | 12.74 | USD 127 |
Nebraska | 12.52 | USD 125 |
Idaho | 12.25 | USD 122 |
North Dakota | 11.93 | USD 119 |
These values assume every kWh replaces power bought from the grid. In practice, how much you save on power you send back to the grid depends on your state's net metering or export rules.
Hidden Costs to Plan For
A solar quote does not always include work your home may need first. Older roofs are often replaced before panels go on, because removing and reinstalling a system later adds cost.
Some homes also need an electrical panel upgrade, tree trimming to remove shade, or extra work on complex roofs with several angles or dormers. Ask installers to list these items separately so you can compare quotes fairly.
How to Work Out Your Own Payback
The payback period is the number of years it takes for savings to cover the cost of the system. Divide your net cost, after any state or local incentives, by your yearly savings on electricity.
To estimate yearly savings, multiply how much electricity your system will produce each year by your electricity price. Installers should give you a production estimate, and you can check it with the free PVWatts calculator from the National Laboratory of the Rockies, formerly the National Renewable Energy Laboratory.
How to Lower Your Cost
With no federal credit for homeowners, the price you negotiate matters more than ever. These steps make the biggest difference:
- Get at least three quotes, since median prices among large installers range from USD 2.40 to USD 6.30 per watt.
- Pay in cash or with a low-cost home equity loan if you can, rather than a solar loan with built-in fees.
- Check state, local and utility incentives in DSIRE, the national database of renewable energy incentives run by the NC Clean Energy Technology Center.
- Size the system to your actual use, including any heat pump or electric car you plan to add.
- Add a battery only if it pays off where you live, for example where exported solar power earns little or backup power is important.
Frequently Asked Questions
How long do home solar panels last?
Most solar panels are designed to last 25 to 30 years or more, and many manufacturers guarantee that they will still produce a large share of their original output after 25 years. Inverters usually need replacing sooner, often after 10 to 15 years.
How many solar panels does a typical house need?
It depends on how much electricity the home uses, how sunny the location is and the size of each panel. Many new residential panels are rated at around 400 watts or more, so a 7.7 kW system would typically use about 19 to 20 panels.
What is net metering?
Net metering is a billing arrangement in which a utility credits solar owners for the extra electricity their panels send to the grid. The rules vary by state and utility, and several states have reduced how much they pay for exported power, which makes batteries more attractive.
Is it better to buy or lease solar panels?
Buying a system means you own it and keep all of the savings, but you pay the full cost upfront or through a loan. Leasing or signing a power purchase agreement lets you go solar with little or no upfront cost, but a third-party company owns the system and you share the savings with it.
Do solar panels work in winter or on cloudy days?
Yes. Solar panels still produce electricity on cloudy days and in cold weather, although output is lower than on sunny days. Panels actually work more efficiently in cooler temperatures, so shorter days, not cold, are the main reason winter output falls.
SOURCES
- Lawrence Berkeley National Laboratory, U.S. Distributed Solar and Storage Data: 2026 Update
- IRS, FAQs for modification of sections 25C, 25D and other credits under the One Big Beautiful Bill Act
- U.S. Energy Information Administration, Short-Term Energy Outlook, Table 7c (November 2026)
- U.S. Energy Information Administration, Electric Power Monthly, Table 5.6.A: Average price of electricity by state
- U.S. Energy Information Administration, Residential electric bills by state (Today in Energy)
- National Laboratory of the Rockies, PVWatts Calculator (version 8)
- NC Clean Energy Technology Center, DSIRE database of state incentives
Written by
Suraj Kadam
Suraj Kadam is a journalist and Chief Editor of CleanTech Journal, a knowledge and media platform covering clean technology, solar energy, and renewable energy. He reports on emerging technologies, industry developments, policy trends, and innovations shaping the global clean energy transition. Through his editorial work, Suraj aims to make complex clean technology topics accessible to industry professionals, researchers, policymakers, and readers interested in sustainable energy. His work focuses on delivering insightful, informative, and engaging coverage of the evolving renewable energy landscape.