Top 10 Nuclear Power Countries Ranked By Generation
These nuclear power countries are ranked by 2025 nuclear electricity generation from the IAEA. United States of America leads with 785.59 TW.h.

Suraj Kadam
Published •20 min read
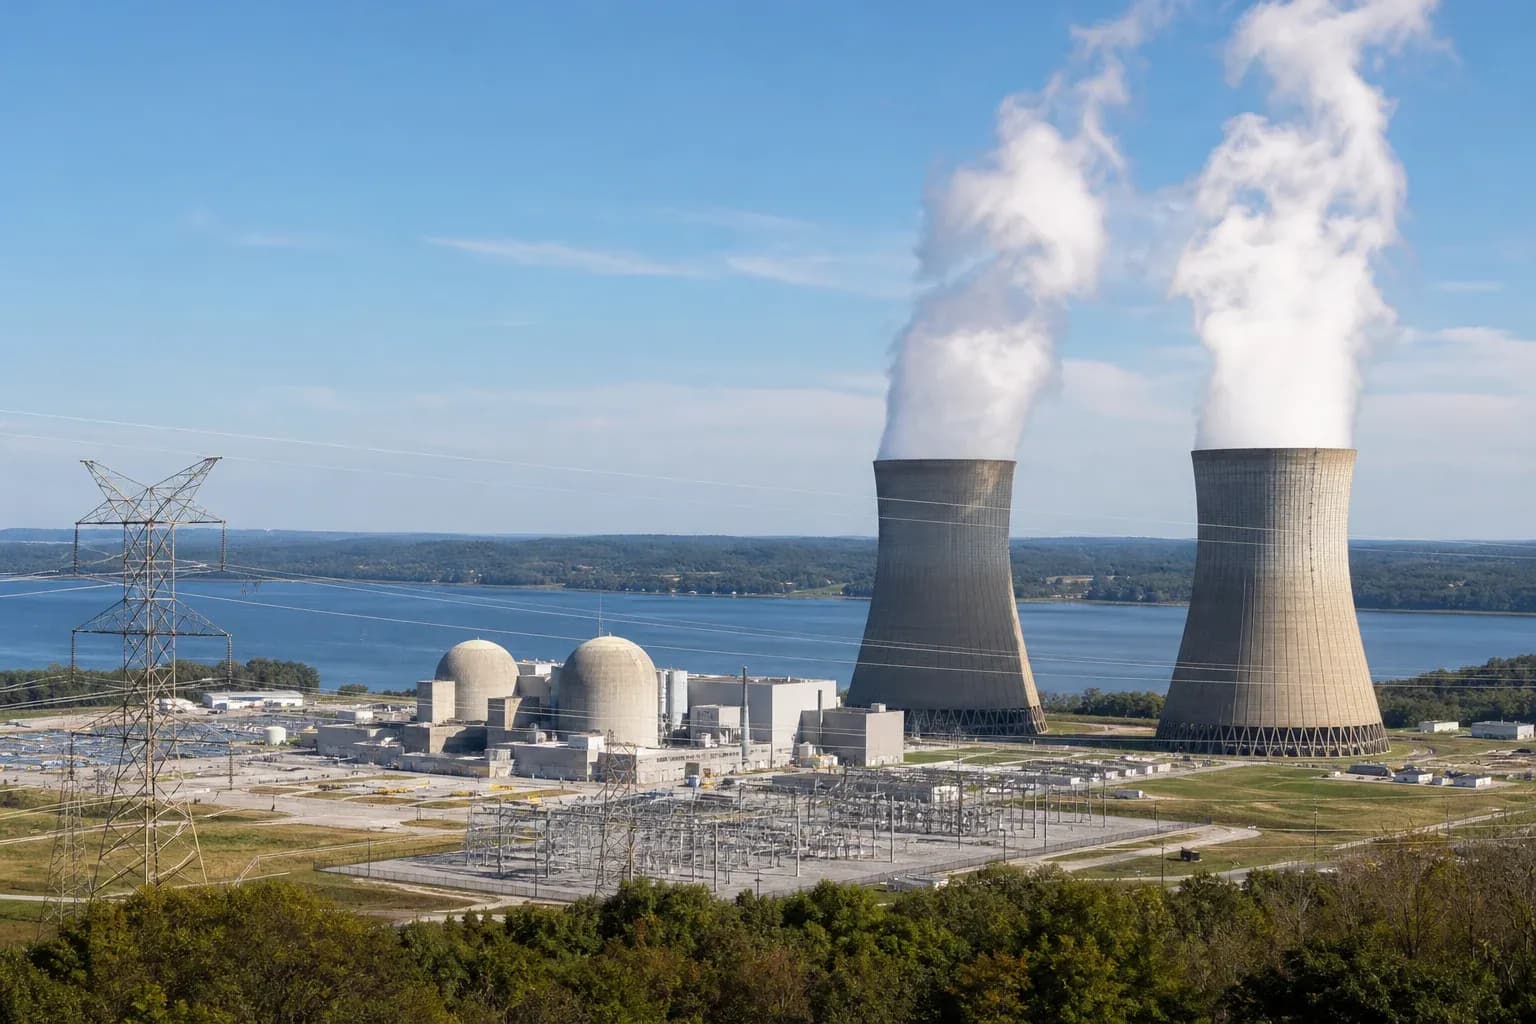
These nuclear power countries are ranked by 2025 nuclear electricity generation, measured in TW.h, using IAEA data from the 2026 edition of Nuclear Power Reactors in the World. The full top 10 is ordered by total TW.h output reported for reactors connected to the grid.
The United States of America leads the ranking at 785.59 TW.h, followed by China at 438.63 TW.h and France at 373.51 TW.h. The IAEA also identified those three countries as the top producers of nuclear electricity in 2025.
Nuclear Power Countries Ranked By Nuclear Electricity Generation
Rank | Country | Nuclear electricity generation (TW.h) |
|---|---|---|
1 | UNITED STATES OF AMERICA | 785.59 |
2 | CHINA | 438.63 |
3 | FRANCE | 373.51 |
4 | RUSSIAN FEDERATION | 204.86 |
5 | KOREA, REPUBLIC OF | 175.55 |
6 | JAPAN | 94.67 |
7 | CANADA | 81.11 |
8 | SPAIN | 51.47 |
9 | INDIA | 49.1 |
10 | SWEDEN | 44.77 |

How We Ranked These 10 Countries
- Ranked by: nuclear electricity generation (TW.h), 2025 data. This is the only measure used for the order.
- Data source: IAEA Nuclear Power Reactors in the World, retrieved 2026-11-07.
- Included: Countries with operating nuclear reactors, by nuclear electricity supplied in the latest year, as reported in the IAEA reference data series Nuclear Power Reactors in the World.
- Excluded: Countries without reactors in operation.
- Ties: none in this list. If two entries had the same figure, nuclear share of electricity would decide.
- Figures: reported exactly as published by the source. CleanTech Journal does not estimate or adjust them; comparisons between entries are our own calculation from these figures.
1. UNITED STATES OF AMERICA: 785.59 TW.h
United States of America tops the nuclear power countries ranking with 785.59 TW.h in 2025, equal to 17.7% of its total electricity. That put it 347.0 TW.h ahead of China in second place. The IAEA says the USA had the largest nuclear fleet in the world at the end of 2025, with 94 operational reactors and 96 952 MW(e) of net capacity. Its operating fleet was made up of 63 PWRs and 31 BWRs, and Table 4 records 5060 years and 11 months of operating experience.
2. CHINA: 438.63 TW.h
China ranks second with 438.63 TW.h, or 5% of total electricity. It trailed the United States of America by 347.0 TW.h and stayed 65.1 TW.h ahead of France. At the end of 2025, China had 58 operational reactors with 56 488 MW(e) of capacity, plus 36 reactors under construction totaling 39 193 MW(e). The IAEA said 9 reactors with a total designed net capacity of 10.6 GW(e) started construction during 2025, lifting capacity under construction from 29.6 GW(e) to 39.2 GW(e) and reinforcing China’s position as the world’s largest nuclear programme under construction.
3. FRANCE: 373.51 TW.h
France is third at 373.51 TW.h. It was 65.1 TW.h behind China and 168.7 TW.h ahead of the Russian Federation. The IAEA also notes that France had the world’s highest share of nuclear power in its electricity mix in 2025, at 68.1%. Its operating fleet stood at 57 reactors with 63 000 MW(e) of net capacity, and Table 2 lists all 57 as PWR units. France also recorded 2614 years and 9 months of operating experience in Table 4.
4. RUSSIAN FEDERATION: 204.86 TW.h
The Russian Federation ranks fourth with 204.86 TW.h, equal to 18.7% of total electricity. It was 168.7 TW.h behind France and 29.3 TW.h ahead of Korea, Republic of. At the end of 2025, it had 34 operational reactors with 27 969 MW(e) of net capacity and 5 reactors under construction totaling 5000 MW(e). The IAEA reported that Leningrad 2-4, a 1150 MW(e) VVER V-491 reactor, started construction in 2025, while the first innovative power unit at Kursk NPP-2-1 was synchronized with the grid in December and reached a capacity of 240 MW(e).
5. KOREA, REPUBLIC OF: 175.55 TW.h
Korea, Republic of sits fifth with 175.55 TW.h in 2025, supplying 31% of total electricity. It trailed the Russian Federation by 29.3 TW.h and led Japan by 80.9 TW.h. The IAEA lists 26 operational reactors with 25 609 MW(e) of net capacity, alongside 3 reactors under construction totaling 4020 MW(e). Table 2 shows a fleet of 23 PWRs and 3 PHWRs. The source text also notes that construction of Shin Hanul-3, an APR-1400 reactor with 1340 MW(e) of original design net electrical capacity, began in April 2025.
6. JAPAN: 94.67 TW.h
Japan ranks sixth with 94.67 TW.h, or 9.4% of total electricity. That left it 80.9 TW.h behind Korea, Republic of, and 13.6 TW.h ahead of Canada. The IAEA recorded 14 operational reactors with 12 631 MW(e) of net capacity at the end of 2025, plus 19 reactors in suspended operation totaling 19 048 MW(e). Japan also had 2 reactors under construction with 2653 MW(e). Table 2 shows its operating fleet included 12 PWRs and 2 BWRs.
7. CANADA: 81.11 TW.h
Canada is seventh with 81.11 TW.h in 2025, providing 13% of total electricity. It followed Japan by 13.6 TW.h and stayed 29.6 TW.h ahead of Spain. The IAEA lists 17 operational reactors with 12 714 MW(e) of net capacity, and Table 2 shows all 17 were PHWR units. Canada also accumulated 879 years and 10 months of operating experience in Table 4, one of the larger totals in this ranking.
8. SPAIN: 51.47 TW.h
Spain ranks eighth with 51.47 TW.h, equal to 18.9% of total electricity. It trailed Canada by 29.6 TW.h and remained 2.4 TW.h ahead of India. At the end of 2025, the country had 7 operational reactors with 7123 MW(e) of net capacity. Table 2 breaks that fleet into 6 PWRs and 1 BWR. Spain also had 384 years and 8 months of operating experience in Table 4.
9. INDIA: 49.1 TW.h
India is ninth with 49.1 TW.h in 2025, or 3.2% of total electricity. It was 2.4 TW.h behind Spain and 4.3 TW.h ahead of Sweden. The IAEA lists 21 operational reactors with 7430 MW(e) of net capacity, 4 reactors in suspended operation totaling 639 MW(e), and 6 reactors under construction totaling 4768 MW(e). In 2025, Rajasthan-7, a 630 MW(e) pressurized heavy water reactor, connected to the grid in March and started commercial operations in April. Table 2 shows India’s operating fleet included 19 PHWRs and 2 PWRs.
10. SWEDEN: 44.77 TW.h
Sweden rounds out the top 10 with 44.77 TW.h, supplying 26.7% of total electricity. It sat 4.3 TW.h behind India, the smallest gap between any adjacent countries in the ranking. The IAEA lists 6 operational reactors with 7012 MW(e) of net capacity at the end of 2025. Table 2 shows a mixed fleet of 2 PWRs and 4 BWRs, while Table 4 records 503 years and 5 months of operating experience.
The Top Three Countries Produced 1597.7 TW.h In 2025
The three leading nuclear power countries — United States of America, China, and France — generated a combined 1597.7 TW.h. That was 69.5% of the 2299.3 TW.h produced by the full top 10, showing how concentrated the ranking is at the top.
There is also a clear break after third place. France in third stood 168.7 TW.h ahead of the Russian Federation in fourth, while the gap between first-place United States of America and tenth-place Sweden was 740.8 TW.h. At the lower end of the list, Spain and India were separated by 2.4 TW.h, and India and Sweden by 4.3 TW.h.
SOURCES
Written by
Suraj Kadam
Suraj Kadam is a journalist and Chief Editor of CleanTech Journal, a knowledge and media platform covering clean technology, solar energy, and renewable energy. He reports on emerging technologies, industry developments, policy trends, and innovations shaping the global clean energy transition. Through his editorial work, Suraj aims to make complex clean technology topics accessible to industry professionals, researchers, policymakers, and readers interested in sustainable energy. His work focuses on delivering insightful, informative, and engaging coverage of the evolving renewable energy landscape.