U.S. Energy Storage Exceeds 200 GWh As 2026 Installations Reach 48.3 GWh
The U.S. added 14.3 GWh of energy storage in Q3 and 48.3 GWh in the first nine months of 2026, lifting cumulative installed capacity above 200 GWh.

CTJ Desk
Published •7 min read
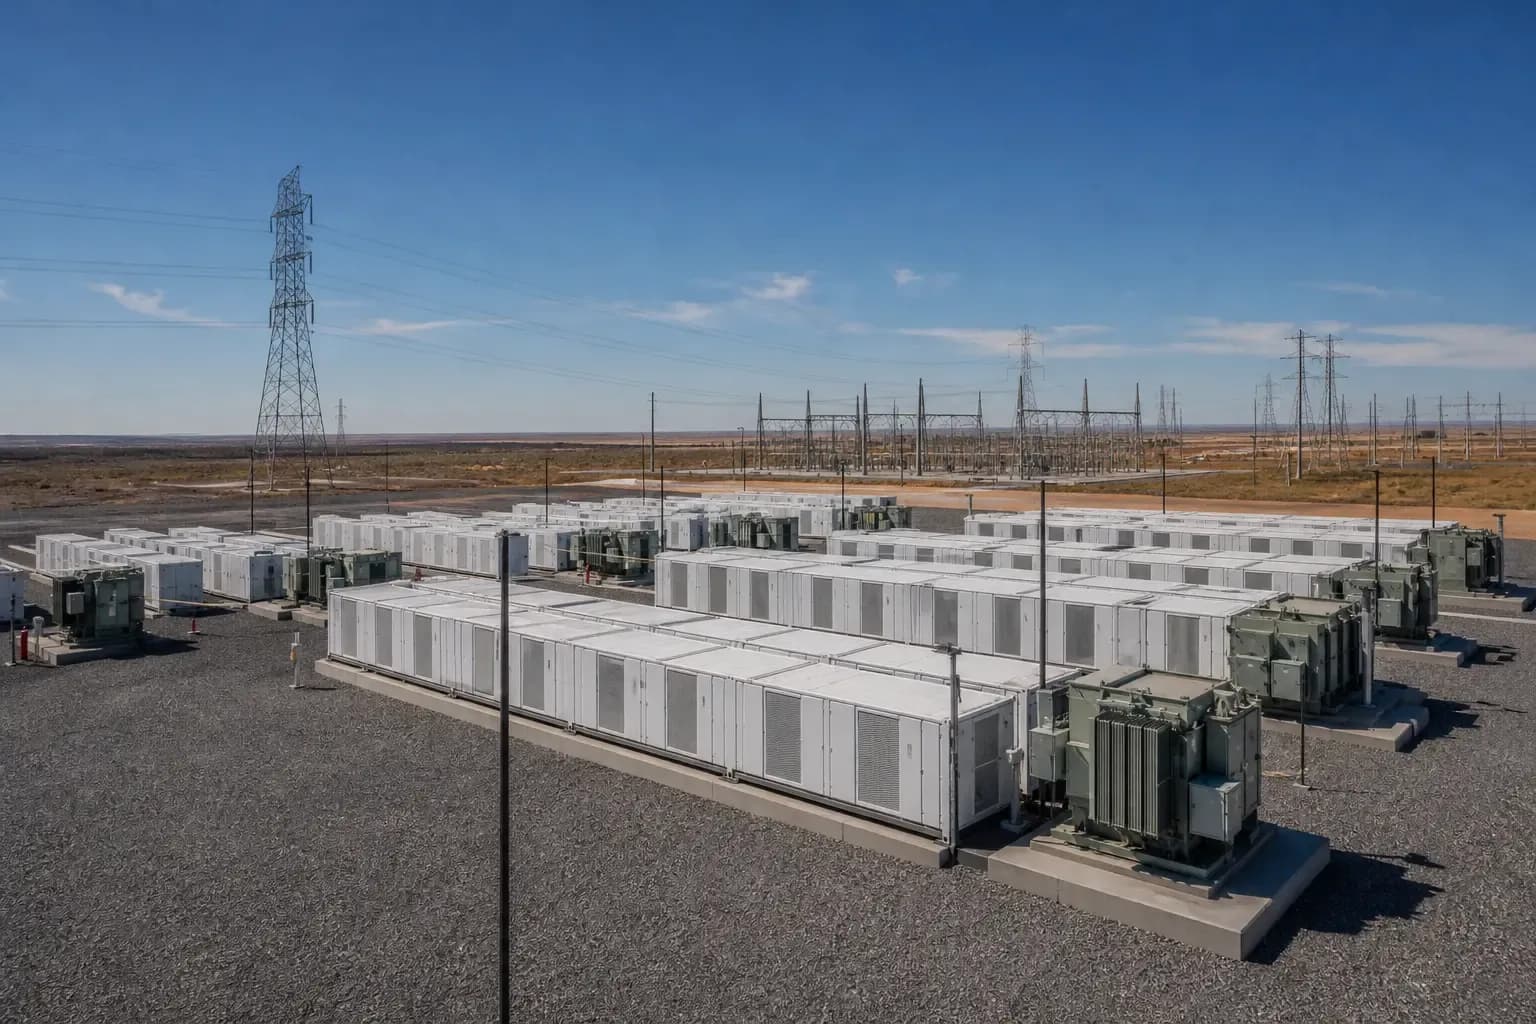
The United States has now installed more than 200 GWh of energy storage capacity after adding 14.3 GWh in the third quarter and 48.3 GWh in the first nine months of 2026, according to the Solar Energy Industries Association. Installations through September were 20% higher than a year earlier, and the market outlook raised its 2030 cumulative deployment forecast to 708 GWh across grid and behind-the-meter systems.
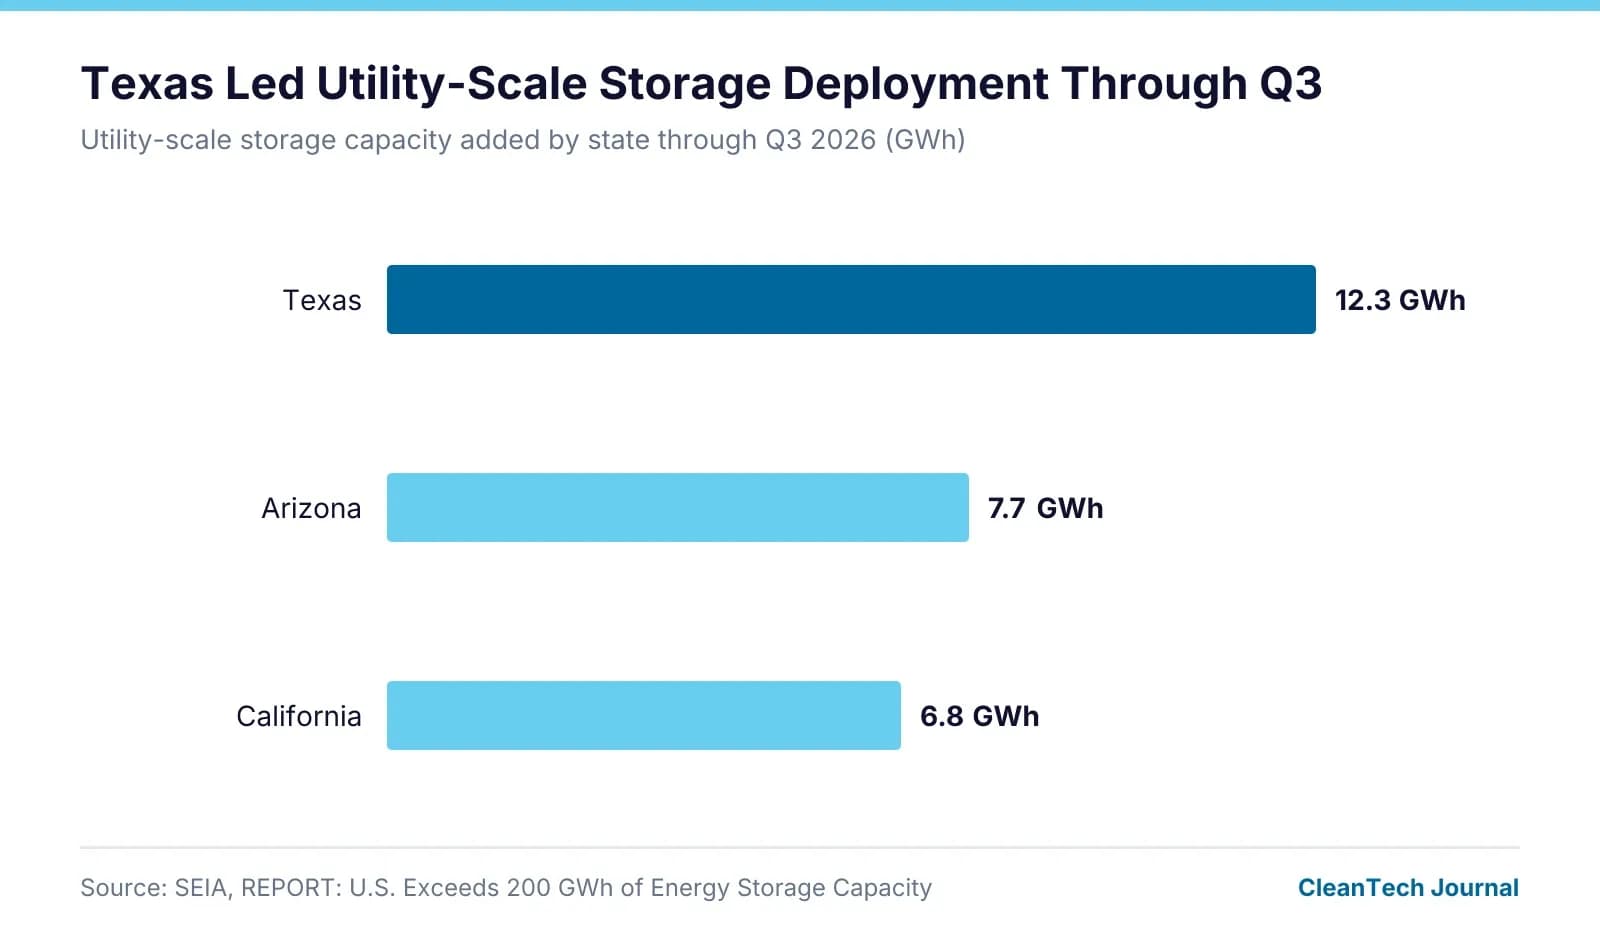
Energy storage additions in 2026 were led by utility-scale projects, while Texas, Arizona, and California posted the largest utility-scale deployment totals through the third quarter. The same outlook also said U.S. battery cell manufacturing capacity reached 92.4 GWh after new facilities opened in Tennessee and Indiana.
48.3 GWh In The First Nine Months Took Cumulative Capacity Past 200 GWh
The latest U.S. Energy Storage Market Outlook Q4 2026 findings show that 14.3 GWh was installed in Q3 alone, bringing the total for January through September to 48.3 GWh.
That year-to-date buildout pushed cumulative installed U.S. energy storage capacity beyond 200 GWh. The outlook said grid operators, utilities, and energy buyers are using storage to lower energy costs and strengthen grid reliability.
The report also increased its 2030 cumulative U.S. deployment forecast by 3.7% to 708 GWh. That forecast covers both grid-scale systems and behind-the-meter installations, which are typically deployed at customer sites such as homes and businesses.
Through the first nine months of 2026, installations were up 20% from the same period a year earlier. The figures point to continued expansion across both large grid-connected projects and smaller customer-sited systems.
Utility-Scale Projects Supplied 12.2 GWh Of Q3 Additions
Utility-scale projects accounted for the vast majority of third-quarter installations. The segment deployed 12.2 GWh in Q3, compared with 1.3 GWh for commercial and industrial storage and 746 MWh for residential storage.
Those figures show how the quarterly total of 14.3 GWh was distributed across the three main market segments tracked in the outlook. Utility-scale batteries are generally connected directly to the power system, while commercial, industrial, and residential systems are installed behind the meter to serve individual sites.
The third-quarter mix is consistent with the broader cumulative milestone. Large grid-connected projects contributed most of the new volume added during the period that lifted the national total above 200 GWh.
Texas, Arizona, And California Led Utility-Scale Deployment Through Q3
Texas recorded the largest amount of utility-scale storage deployment through Q3, adding 12.3 GWh. Arizona followed with 7.7 GWh, and California added 6.8 GWh.
A recent analysis also found that rapid growth in solar and energy storage helped reduce average wholesale electricity prices by 42% in Texas and 51% in California between summer 2021 and summer 2026.
Beyond the three leading states, 11 states had already exceeded their previous annual energy storage installation records by the end of Q3, with three months still remaining in 2026. Those states were Colorado, Massachusetts, Utah, Michigan, Georgia, Mississippi, Virginia, Iowa, Montana, Alabama, and Illinois.
The list shows that new annual highs were reached across multiple regions of the country during the first three quarters of the year.
Cell Manufacturing Capacity Reached 92.4 GWh After Two 2026 Openings
Domestic battery manufacturing capacity also expanded during the year. In July, a new battery cell manufacturing facility opened in Tennessee. In October, another cell manufacturing facility opened in Indiana.
After those openings, total U.S. cell manufacturing capacity reached 92.4 GWh, which the outlook described as a 50% increase. The manufacturing additions were presented alongside the deployment figures as part of the industry update for 2026.
The longer-term forecast moved higher as well. The outlook raised its 2030 cumulative deployment expectation to 708 GWh across grid and behind-the-meter storage, reflecting stronger projected totals for the rest of the decade.
Taken together, the 14.3 GWh installed in Q3, the 48.3 GWh added through the first nine months of 2026, and the cumulative total above 200 GWh mark the current scale of the U.S. storage market. State-level deployment, segment-level installation data, and manufacturing capacity figures in the outlook all show how that total was reached during the year.
SOURCES
- SEIA: REPORT: U.S. Exceeds 200 GWh of Energy Storage Capacity – SEIA